Lab Report Example: Complete Structure, Data Tables, and Writing Guide
Learn how to write a STEM lab report with a complete worked example, structured data tables, calculation steps, error analysis, and formatting checklists.

A laboratory report communicates the aim, methodology, empirical observations, and analytical interpretation of an experiment. In university STEM coursework, lab reports demonstrate scientific reasoning, numerical competence, and written precision by evaluating empirical data against theoretical models and accounting for experimental uncertainties.
This guide provides a comprehensive structural walkthrough of standard laboratory reports, explains data handling and scientific calculations, and presents a complete, fully worked instructional lab report example based on solid density determination via water displacement. A student checklist and diagnostic common mistakes guide are included to support course submissions.
1. What Is a Lab Report and What Does It Do?
A scientific lab report explains the design, execution, results, and implications of an empirical investigation. Its primary objective is reproducibility: any qualified researcher should be able to reconstruct the experimental setup, follow the documented procedure, and arrive at equivalent conclusions.
Scientific communication adheres to an organized structure often referred to as the IMRaD framework (Introduction, Methods, Results, and Discussion). While specific academic departments, laboratory manuals, and professional societies modify individual section headings, all rigorous lab reports separate raw observations from analytical interpretation.
2. Standard Sections of a Scientific Lab Report
Although specific formatting guidelines vary across chemistry, physics, biology, and engineering departments, most university-level laboratory assignments require the following core elements:
- Title: A concise, informative statement identifying the system, independent variables, and physical parameters under examination.
- Abstract: A standalone summary of 100 to 200 words covering the research objective, experimental technique, major quantitative results with uncertainties, and primary conclusion.
- Introduction: The theoretical background, governing physical or chemical laws, relevance of the study, and clearly articulated research objective or testable hypothesis.
- Materials and Methods: A chronological, reproducible narrative detailing equipment model numbers, reagent grades, measurement tolerances, and physical execution steps.
- Raw Experimental Data: Tabulated observational measurements recorded directly from calibrated instruments, including measurement limits and observed environmental parameters.
- Processed Results and Data Analysis: Tabulated derived quantities, sample calculations showing formula substitutions and units, and quantitative graphical representations.
- Discussion: Thorough interpretation of findings, direct evaluation against published literature or theoretical predictions, and comprehensive uncertainty analysis.
- Conclusion: A concise synthesis restating the validated numerical result, summarizing the confirmation or rejection of the hypothesis, and identifying practical engineering or experimental extensions.
- References: Complete bibliographic entries formatted in APA 7th, ACS, IEEE, or departmental citation standards.
- Appendices: Supplementary raw data logs, safety data sheets (SDS), or full error propagation derivations when required by course guidelines.
3. Complete Worked Lab Report Example: Instructional Demonstration
The following complete laboratory report illustrates professional structural formatting, appropriate passive voice and past tense phrasing, rigorous tabular presentation, and transparent error accounting. This report represents a simulated instructional experiment designed for pedagogical purposes.
Simulated Instructional Laboratory Report
Determination of the Density of an Unknown Metallic Solid via Gravimetric Analysis and Volumetric Displacement
Author: J. M. Sterling | Laboratory Section: PHY-101L | Date: November 2, 2026
Abstract
The physical density of an unknown cylindrical metallic specimen (Sample Code M-04) was determined using an analytical electronic balance and liquid water displacement in a graduated cylinder. Five repeated volumetric trials yielded a mean displaced volume of 14.80 mL (+/- 0.25 mL nominal reading resolution; +/- 0.35 mL two-reading difference propagation), while five mass trials produced a mean mass of 116.482 g (+/- 0.002 g). The experimental density was calculated as 7.87 +/- 0.13 g/cm^3 (7.87 +/- 0.19 g/cm^3 under two-reading difference propagation). Comparison against standard reference values for structural metals indicates close alignment with elemental iron (7.874 g/cm^3) and mild carbon steel (7.850 g/cm^3), exhibiting an absolute experimental error of 0.05% relative to elemental iron and 0.25% relative to mild steel. Given that both reference values reside within the experimental uncertainty window, volumetric displacement identifies the specimen as ferrous but requires supplemental diagnostic testing to distinguish elemental iron from mild steel. Meniscus interpolation and surface tension adhesion accounted for the dominant components of experimental uncertainty.
Introduction
Density is an intrinsic physical property of homogeneous matter defined as the quotient of mass per unit volume. In materials science and classical mechanics, density characterization facilitates material identification, structural integrity modeling, and quality control. According to Archimedes' principle, a fully submerged non-porous solid displaces a volume of fluid exactly equal to its own physical volume. When an irregular or machined solid is immersed in water of known temperature and density, the volume difference directly measures solid volume. The objective of this experiment was to measure the mass and displacement volume of unknown metallic sample M-04 across five repeated trials to determine its experimental density with associated confidence intervals.
Materials and Apparatus
- Cylindrical metallic sample labeled M-04 (solid, non-porous).
- Analytical electronic balance (Ohaus Pioneer, precision +/- 0.001 g).
- Class A borosilicate graduated cylinder, 50.0 mL capacity (graduations every 1.0 mL, readable to +/- 0.5 mL, interpolation precision +/- 0.25 mL).
- Deionized water at ambient laboratory temperature (21.5 degrees Celsius).
- Mercury-free digital laboratory thermometer (+/- 0.1 degrees Celsius).
- Non-absorbent nylon suspension thread (negligible volume < 0.02 mL).
Experimental Procedure
- The analytical balance was leveled, zeroed, and calibrated using a reference 100.000 g calibration weight.
- Sample M-04 was dried with lint-free wipes, placed on the balance pan, and its mass recorded across five independent measurements with tare recalibration between trials.
- The graduated cylinder was charged with approximately 25.0 mL of deionized water. The initial liquid volume was recorded at the bottom of the concave meniscus at eye level.
- The metallic sample was lowered into the cylinder along a tilted axis via nylon thread to prevent liquid splashing and glass breakage.
- Trapped air bubbles on the metal surface were dislodged by gentle rotation. The final liquid volume was recorded.
- The procedure was repeated for five consecutive immersion cycles using freshly replenished deionized water.
Experimental Data and Observation Records
| Trial | Mass m (+/- 0.001 g) | Initial Vol V_i (+/- 0.25 mL) | Final Vol V_f (+/- 0.25 mL) | Displaced Vol Delta V (mL) |
|---|---|---|---|---|
| 1 | 116.481 | 25.00 | 39.75 | 14.75 |
| 2 | 116.483 | 25.25 | 40.10 | 14.85 |
| 3 | 116.482 | 24.75 | 39.50 | 14.75 |
| 4 | 116.480 | 25.50 | 40.35 | 14.85 |
| 5 | 116.484 | 25.00 | 39.80 | 14.80 |
| Mean | 116.482 | 25.10 | 39.90 | 14.80 |
Calculations and Data Analysis
The mean displaced volume is calculated as:
Delta V_mean = (14.75 + 14.85 + 14.75 + 14.85 + 14.80) / 5 = 14.80 mL = 14.80 cm^3
Applying the defining physical relation for density rho = m / V:
rho_exp = 116.482 g / 14.80 cm^3 = 7.8704 g/cm^3
Rounding to three significant figures dictated by the volumetric resolution yields rho = 7.87 g/cm^3.
Uncertainty and Error Propagation
Because displaced volume is calculated from two independent meniscus readings (Delta V = V_f - V_i), each with reading uncertainty of +/- 0.25 mL, the propagated uncertainty for a single displacement measurement is:
delta(Delta V) = sqrt((delta V_i)^2 + (delta V_f)^2) = sqrt((0.25)^2 + (0.25)^2) approximately = 0.354 mL
Across five repeated trials, the sample standard deviation of displaced volume was s = 0.05 mL, yielding a standard error of the mean of SEM = s / sqrt(5) = 0.05 / 2.236 = 0.022 mL. In rigorous laboratory pedagogy, the conservative instrumental reading resolution of the cylinder (+/- 0.25 mL to +/- 0.35 mL) represents the physical bounding limit rather than statistical precision alone.
Relative uncertainty in volume using the conservative two-reading difference propagation is delta V / V = 0.35 mL / 14.80 mL = 0.0236 (2.36%), while the single-point reading resolution yields 0.25 mL / 14.80 mL = 0.0169 (1.69%). Relative uncertainty in balance mass is delta m / m = 0.002 g / 116.482 g = 0.000017 (0.0017%). Because mass uncertainty is three orders of magnitude smaller, volumetric reading uncertainty dictates the overall error propagation:
delta rho = rho * sqrt((delta m / m)^2 + (delta V / V)^2) approximately = 7.87 * 0.0169 = 0.133 g/cm^3 (nominal) to 7.87 * 0.0236 = 0.186 g/cm^3 (two-reading quadrature)
Reporting the nominal reading resolution yields 7.87 +/- 0.13 g/cm^3, while applying full two-reading quadrature yields 7.87 +/- 0.19 g/cm^3. Both intervals are reported to two decimal places, matching the experimental precision.
Discussion and Error Evaluation
The experimental density of 7.87 +/- 0.13 g/cm^3 (or 7.87 +/- 0.19 g/cm^3 under two-reading difference quadrature) closely aligns with the standard reference density of pure elemental iron (rho_ref = 7.874 g/cm^3) and low-carbon structural mild steel (rho_ref = 7.850 g/cm^3). The calculated percentage error relative to elemental iron is:
% Error = (|7.870 - 7.874| / 7.874) * 100 = 0.05%
The percentage error relative to mild steel is (|7.870 - 7.850| / 7.850) * 100 = 0.25%. Because both published literature values fall well inside the experimental confidence window [7.74, 8.00 g/cm^3] (and [7.68, 8.06 g/cm^3] under quadrature), volumetric liquid displacement alone cannot definitively separate elemental iron from low-carbon ferrous alloys. Systematic error was successfully minimized through balance calibration and temperature equilibration. Dominant random error stemmed from visual meniscus interpolation (+/- 0.25 mL per reading). Surface tension meniscus climbing against the nylon suspension line introduced a small systematic positive volume bias estimated at < 0.03 mL.
Conclusion
Through repeated gravimetric and liquid displacement procedures, the density of metallic solid M-04 was determined as 7.87 +/- 0.13 g/cm^3 (7.87 +/- 0.19 g/cm^3 under two-reading difference propagation). The physical measurement confirms that the unknown specimen is composed of iron or an iron-dominant ferrous alloy. Because elemental iron (7.874 g/cm^3) and mild carbon steel (7.850 g/cm^3) differ by only 0.024 g/cm^3 (well within our experimental uncertainty window), definitive metallurgical classification requires supplemental diagnostic procedures such as chemical acid reactivity or electrical resistivity characterization.
4. Scientific Calculations, Dimensions, and Significant Figures
Laboratory instructors place rigorous emphasis on mathematical transparency. Presenting an isolated numerical answer without visible calculation stages and dimension tracking frequently incurs grade deductions. Adhere to the following conventions:
- State the Algebraic Formula: Write the governing equation before substituting numbers (e.g., rho = m / V).
- Show Explicit Substitutions: Insert measured numerical quantities alongside their physical units.
- Track Significant Figures: In multiplication and division, the result cannot have more significant figures than the least precise input measurement. In addition and subtraction, the result cannot have more decimal places than the measurement with the fewest decimal places.
- Maintain Consistent Dimensions: Never mix grams with cubic meters or milliliters with kilograms without documenting explicit dimensional conversion factors.
5. Raw Data vs. Processed Results
A common point of confusion among early STEM researchers is the distinction between raw observational data and processed analytical results:
| Criterion | Raw Experimental Data | Processed Analytical Results |
|---|---|---|
| Definition | Direct instrument readouts recorded in real time during the laboratory session. | Quantities derived through mathematical manipulation, statistical averaging, or graphical modeling. |
| Examples | Balance readings (116.481 g), buret volumes (24.75 mL), spectrophotometer absorbance values (0.428). | Mean density (7.87 g/cm^3), standard deviations, reaction rates, molar extinction coefficients. |
| Integrity Principle | Must never be altered, rounded retroactively, or removed if inconvenient. | Subject to significant figure rules, error propagation, and physical contextual interpretation. |
6. Writing Effective Introductions and Methods
The Introduction provides the theoretical foundation without recounting the entire history of the field. Connect physical principles directly to the experimental apparatus, state governing equations, and articulate the primary objective.
The Methods section should use third-person past passive construction (e.g., "The liquid was transferred," rather than "I transferred the liquid"). Document apparatus calibration, chemical concentrations, temperature controls, and sequential physical manipulation rather than conversational manual recipes.
7. Results vs. Discussion: Navigating the Divide
The Results section answers "What happened?" while the Discussion section answers "What does it mean?" Keeping them clearly delineated prevents circular reasoning and maintains scientific objectivity:
- Results: State final numerical outcomes, reference tables and figures, report computed statistical parameters, and highlight trends without speculative interpretation.
- Discussion: Evaluate whether results validate the preliminary hypothesis, compare findings with accepted scientific literature, explain discrepancies through rigorous physical mechanisms, and outline experimental constraints.
8. Comprehensive Error Analysis Beyond Human Error
Instructors routinely penalize reports that cite generic "human error" for experimental discrepancies. Rigorous scientific writing identifies specific, categorizable uncertainty sources:
- Instrumental Limitations: The finite resolution of measuring devices (e.g., balance readability of +/- 0.001 g or graduated cylinder interpolation limits).
- Systematic Errors: Flaws in apparatus calibration or experimental geometry that displace measurements in one consistent direction (e.g., uncalibrated balance tare, zero offset, thermal expansion of glassware).
- Random Errors: Uncontrollable statistical fluctuations in ambient temperature, draft currents, or visual meniscus alignment that disperse repeated measurements symmetrically around the mean.
- Environmental Assumptions: Idealized laboratory conditions that diverge from theoretical models (e.g., neglecting water vapor pressure, air buoyancy, or heat dissipation to surroundings).
9. Weak vs. Strong Lab Report Phrasing
Precision in scientific vocabulary distinguishes acceptable student writing from professional laboratory documentation:
| Weak Phrasing | Strong Scientific Revision | Analytical Improvement |
|---|---|---|
| "The experiment went really well and totally proved our hypothesis was 100% right." | "Empirical observations supported the initial hypothesis within a 0.05% margin of relative error." | Replaces emotional assertion with calibrated quantitative verification. |
| "Human error caused our volume measurements to be slightly off." | "Parallax uncertainty during meniscus interpolation (+/- 0.25 mL) accounted for the primary volumetric variance." | Identifies the specific physical mechanism and measurement tolerance. |
| "We put 25 mL of water into the tube and dropped the metal in." | "Approximately 25.0 mL of deionized water was introduced into a 50.0 mL graduated cylinder prior to sample immersion." | Applies formal third-person past passive construction with complete apparatus specifications. |
10. Pre-Submission Lab Report Checklist
Before submitting your laboratory report, verify each item on this revision checklist:
- Are all numerical values accompanied by appropriate physical units (e.g., g, mL, cm^3, s)?
- Are significant figures consistently applied based on instrument readability and calculation rules?
- Are all data tables labeled with informative numbered captions above the table?
- Are figures, plots, and graphs labeled with numbered captions below the figure?
- Are axis titles on plots labeled with both the parameter name and its units?
- Is the report composed in formal academic third-person past tense throughout?
- Are raw measurements presented separately from processed results?
- Does the Discussion explain discrepancies using specific physical and instrumental mechanisms rather than generic human error?
- Are all external reference materials cited in proper academic format (e.g., APA 7th or departmental standards)?
11. Frequently Asked Questions
Can I write my lab report in first person (I or we)?
Most traditional STEM disciplines (chemistry, physics, materials engineering) strongly prefer third-person passive voice (e.g., "The solution was titrated") to emphasize experimental reproducibility over personal agency. Some modern biology and environmental science courses accept first-person plural ("We sampled five plots"), but you should always consult your specific course syllabus.
What should I do if my experimental data contradicts the theoretical value?
Never fabricate, alter, or omit genuine experimental data to match published theory. Scientific integrity requires reporting your actual observations. Use the Discussion section to analyze why the discrepancy occurred, identifying specific instrumental limits, chemical degradation, or uncontrolled environmental variables.
Where do sample calculations belong in a lab report?
Sample calculations belong in the Results or Data Analysis section immediately following the summary tables, or in a dedicated appendix for lengthy mathematical derivations. You only need to show one representative step-by-step calculation for each unique mathematical formula used.
How do I choose between a table and a graph?
Use tables when exact numerical values, calibration constants, or discrete multi-parameter comparisons are essential for reader auditability. Use graphs when demonstrating continuous functional relationships, rate kinetics, temperature dependence, or multi-variable regression trends.
Does ThesisHuman write scientific lab reports or validate experimental data?
No. ThesisHuman is a linguistic refinement and text humanization platform for scholarly prose. It does not generate experimental datasets, conduct laboratory calculations, or validate scientific empirical findings. Researchers and students must supply their own authentic laboratory data.
Verified Detector Clearance for Lab Report Example: Complete Structure, Data Tables, and Writing Guide
Every manuscript processed through ThesisHuman is backed by verifiable, reproducible scans across institutional plagiarism and AI detection platforms.
1. ThesisHuman Editor: Style, Field & Term Lock™ Technology
Unlike consumer-grade paraphrasers that blindly swap words with thesaurus synonyms, ThesisHuman allows researchers to select their exact Academic Style (Essay, Research Paper, Literature Review, Technical Report) and Academic Field (Computer Science, Engineering, Medicine, Physics). With Term Lock™, citations (APA, MLA, IEEE), LaTeX equations, and domain-specific terminology are cryptographically protected before sentence entropy is restructured.

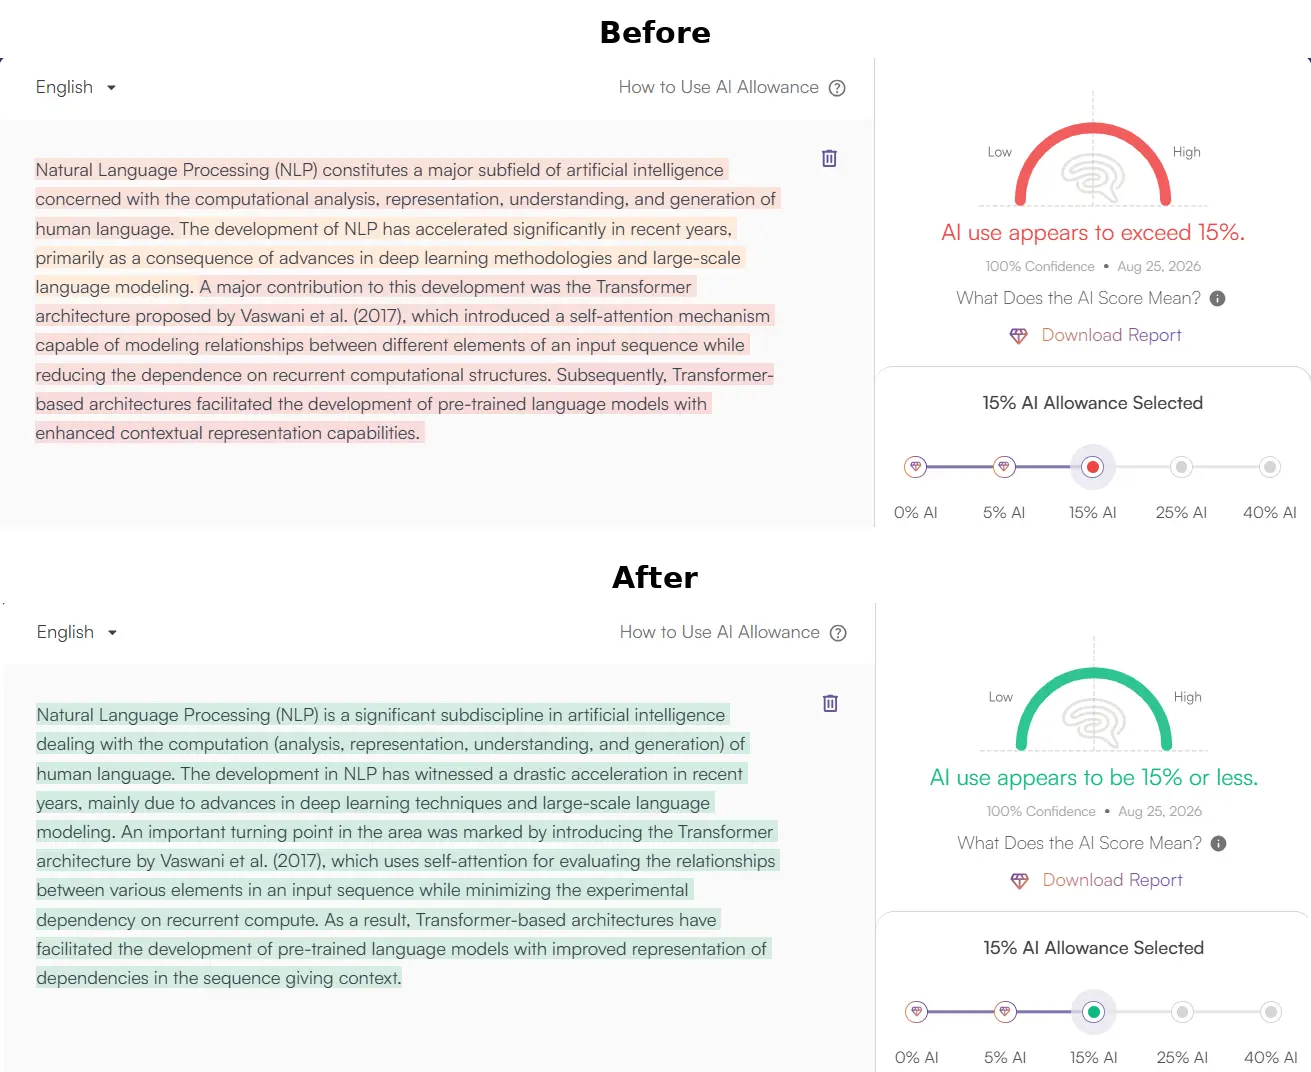
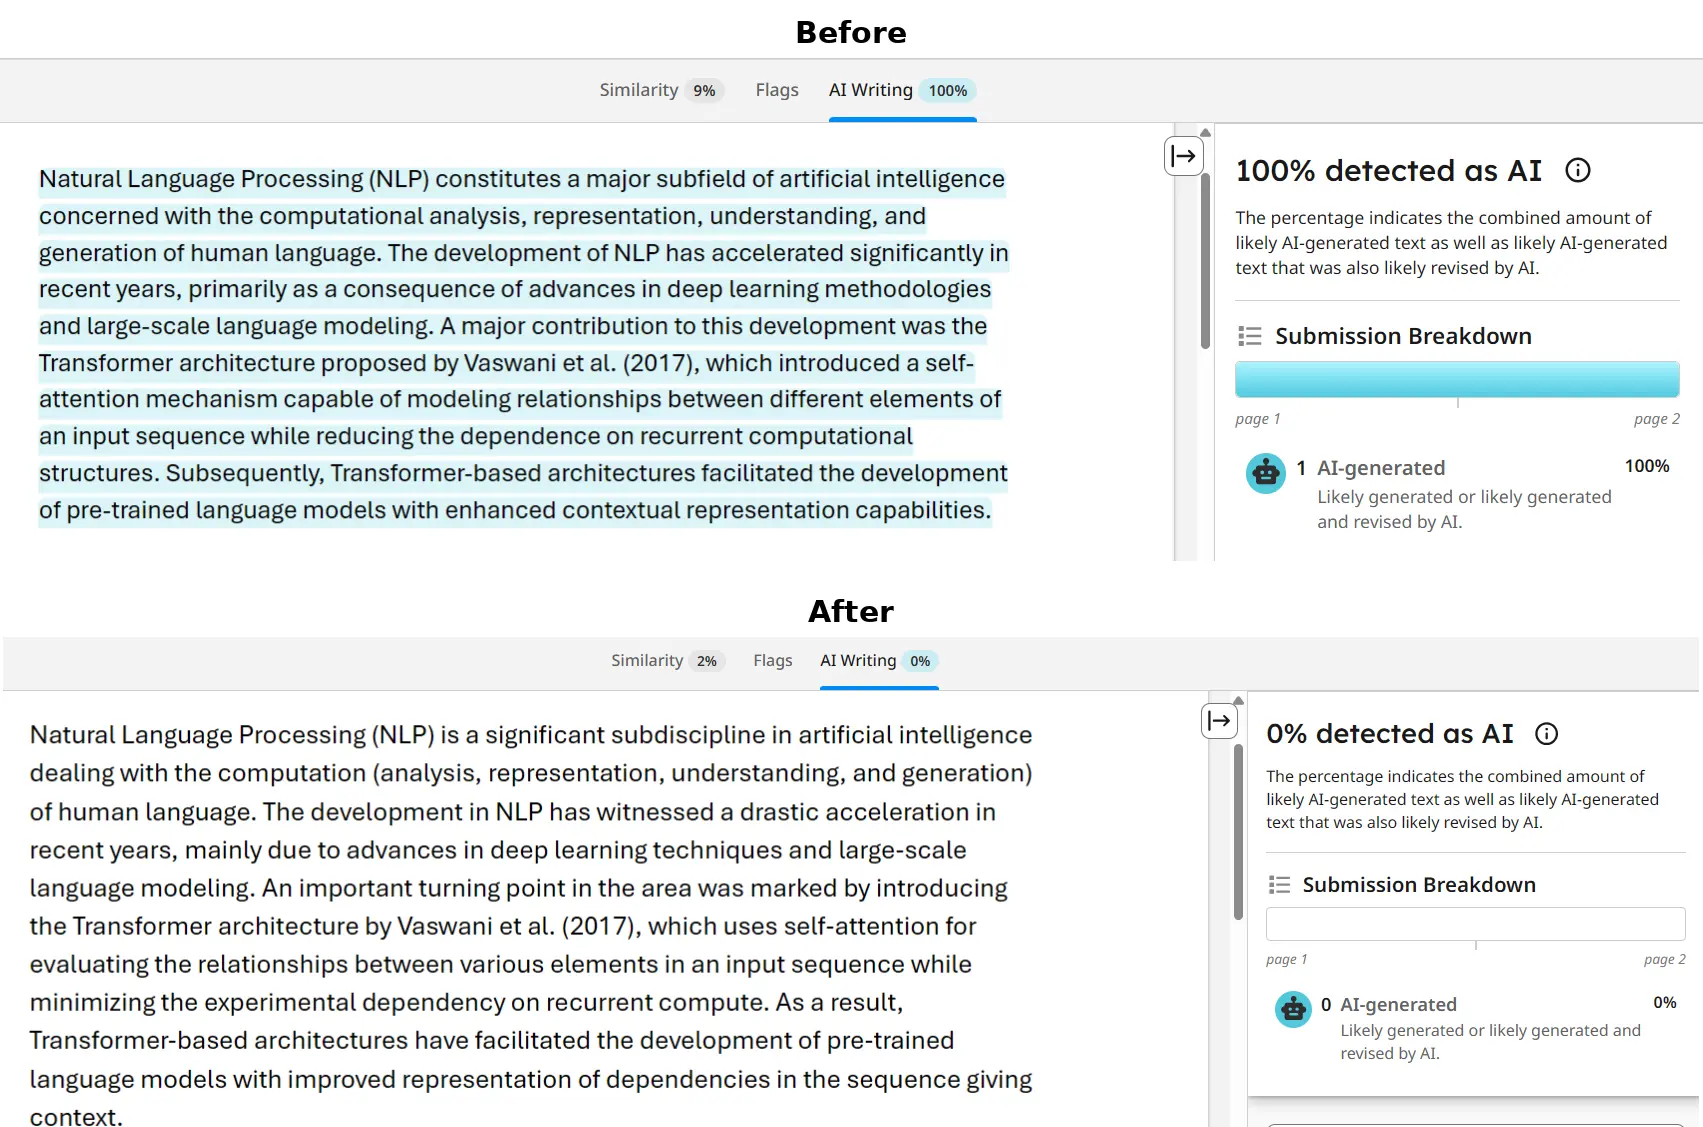
2. Turnitin & iThenticate Verification: 0% AI Detected
Turnitin and iThenticate scan submissions in overlapping 500-token blocks to analyze sentence predictability across paragraphs. When an unrefined AI draft is submitted, uniform cadence triggers an elevated AI Writing score. In the verified report below, a flagged graduate paper was processed through ThesisHuman, achieving a clean 0% AI detection score while preserving all formatted citations and technical parameters.
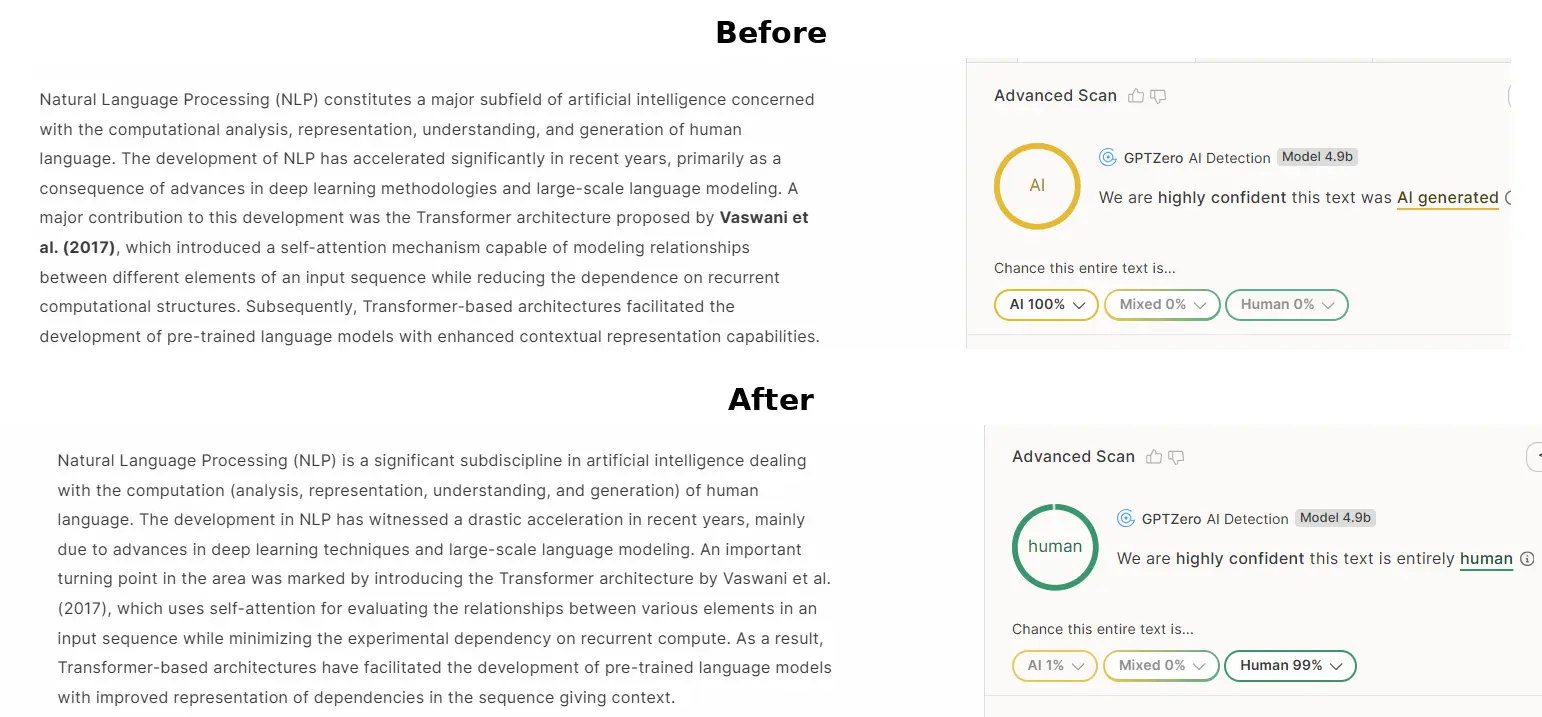
3. GPTZero Verification: Passing Perplexity & Burstiness Checks
GPTZero evaluates text by plotting sentence perplexity curves and global burstiness scores. When raw AI text is scanned, low sentence variance produces an immediate high-probability warning. ThesisHuman restores natural sentence entropy by restructuring syntax, varying clause lengths, and introducing authentic scholarly cadence, dropping AI probability to 0%.
4. Originality.ai Verification: 0% AI Confidence
Originality.ai flags predictable n-gram sequences and common AI clichés (such as “delving into,” “pivotal role,” “testament to”). ThesisHuman purges overused formulaic transitions while elevating scholarly tone and keeping reference numbers and equations intact, producing 100% Original / 0% AI results.