Literature Review Matrix Template: Examples and Step-by-Step Guide
Learn how to build, structure, and synthesize a literature review matrix for your dissertation, thesis, or research paper with step-by-step guidance, templates, and worked multi-disciplinary models.

A literature review matrix is a structured tabular grid that researchers use to extract, organize, and synthesize key information across multiple scholarly sources. Instead of reading dozens of articles sequentially and attempting to recall their nuances from memory, a matrix allows you to record authors, theoretical frameworks, methodological approaches, sample characteristics, empirical findings, and identified limitations in standardized columns.
By converting unstructured journal articles into aligned data points, a synthesis matrix shifts your review process from passive summarization to active comparative analysis. It serves as the intellectual bridge between searching academic databases and drafting a coherent, publication-grade literature review for a dissertation, master's thesis, or peer-reviewed journal submission.
1. Direct Answer: What Is a Literature Review Matrix?
A literature review matrix (often termed a synthesis matrix or evidence table) is a systematic organizational instrument designed to facilitate comparative scholarly analysis. It cross-references individual research studies against consistent conceptual and methodological dimensions.
At its core, a literature review matrix answers three fundamental operational questions for the researcher:
- What specific empirical data, methodologies, and theories exist across the published literature on my topic?
- Where do published findings converge, where do they diverge, and what methodological variations account for these differences?
- Where are the authentic research gaps that justify my upcoming study or thesis question?
Without a matrix, graduate students and early-career researchers frequently fall into the trap of writing disconnected article summaries (often called an 'annotated bibliography disguised as a literature review'). With a matrix, each source becomes an evidence point within an integrated, multi-source conversation.
2. Why Researchers Use Literature Review Matrices
Constructing a formal matrix requires initial time, but it saves weeks of disorganized rewriting during the drafting phase. Doctoral supervisors and peer-reviewed journal editors expect literature reviews to provide critical synthesis rather than linear book reports.
Researchers rely on synthesis matrices for four primary strategic advantages:
- Cognitive Load Reduction: Managing 50 or 100 peer-reviewed articles mentally is impossible. Standardizing source details into structured rows offloads working memory and prevents detail confusion.
- Direct Pattern Recognition: When columns align sample sizes, statistical measures, or theoretical lenses side by side, overarching patterns and thematic groupings emerge immediately.
- Methodological Auditability: A matrix makes discrepancies visible. If three studies find a positive association between two variables while two studies find no relationship, inspecting the methodology column often reveals that the conflicting studies employed different instruments or non-representative samples.
- Defense Against Accidental Omission: Maintaining a transparent tracking grid ensures that seminal theories, foundational authors, and critical counterarguments are systematically accounted for prior to writing.
3. Common Matrix Types and Their Research Purposes
Depending on your academic discipline and the purpose of your review, different matrix configurations yield different analytical insights. Below are four fully worked matrix models illustrating how to structure data across different analytical angles.
Note: All studies in the illustrative tables below represent hypothetical research models designed to demonstrate correct matrix formatting and data extraction.
A. Literature Summary Matrix (5 Illustrative Sources)
The summary matrix is an exploratory grid capturing bibliographic attribution, core purpose, design, findings, and stated limitations across candidate papers:
| Citation & Year | Research Purpose | Theoretical Framework | Methodology & Sample | Key Findings | Methodological Limitations |
|---|---|---|---|---|---|
| Vasquez & Lin (2024) [Illustrative Study] | Evaluate adaptive AI tutoring on undergraduate calculus retention | Cognitive Load Theory (Sweller, 1988) | Randomized controlled trial (RCT), n = 340 undergraduates, 16-week semester | Adaptive tutoring group showed 22% higher final exam scores (p < .01, d = 0.64) | Sample limited to single engineering faculty; voluntary participation bias |
| Morrison & Henderson (2023) [Illustrative Study] | Investigate asynchronous peer feedback on graduate writing quality | Social Constructivism (Vygotsky, 1978) | Mixed methods (survey + textual analysis), n = 88 master's students | Peer feedback improved draft revisions by 14%, but 38% reported feedback ambiguity | Non-validated rubric used for textual scoring; small sample size |
| Al-Hassan et al. (2022) [Illustrative Study] | Assess gamified quiz mechanics on secondary biology engagement | Self-Determination Theory (Ryan & Deci, 2000) | Quasi-experimental pretest-posttest, n = 512 high school students, 8 schools | Gamification increased engagement scores by 31% but showed no significant impact on test scores | Short intervention window (4 weeks); lack of delayed retention testing |
| O'Connor & Davies (2023) [Illustrative Study] | Examine mobile flashcard application usage and longitudinal vocabulary retention | Spaced Repetition Theory (Ebbinghaus, 1885) | Longitudinal observational cohort, n = 195 language learners, 12 months | Daily active users retained 45% more vocabulary at 6 months compared to sporadic users | High attrition rate (42% dropout by month 12); self-selected study intervals |
| Tanaka & Kim (2024) [Illustrative Study] | Explore instructor dashboard analytics on early student intervention | Community of Inquiry (Garrison et al., 2000) | Qualitative multiple case study, n = 24 faculty members across 3 universities | Early analytics alerts prompted earlier outreach, reducing mid-semester withdrawals by 9% | Relies on self-reported faculty logs; institutional tech variations |
B. Thematic Synthesis Matrix
A thematic matrix groups sources across specific conceptual themes, illuminating consensus and divergence:
| Author (Year) | Theme 1: Autonomous Cognitive Engagement | Theme 2: Synchronous Pedagogical Scaffolding | Theme 3: Formative Assessment Latency |
|---|---|---|---|
| Vasquez & Lin (2024) | High: Adaptive problem sequencing reduced extraneous cognitive load | Moderate: System replaced human scaffolding during practice modules | Instantaneous: Immediate algorithmic feedback corrected errors in real time |
| Morrison & Henderson (2023) | Moderate: Required high intrinsic motivation to engage peer critiques | High: Depended on reciprocal peer scaffolding within structured groups | Delayed: Peer reviews took average of 72 hours, slowing revision cycles |
| Al-Hassan et al. (2022) | Variable: Fostered extrinsic motivation through badges but transient engagement | Low: Teacher involvement was minimal during gamified sessions | Rapid: Quizzes provided immediate scores without qualitative explanations |
| O'Connor & Davies (2023) | High: Algorithm adapted intervals based on individual retrieval speed | None: Autonomous self-directed application without instructor interface | Immediate: Flashcard verification delivered instant binary feedback |
| Tanaka & Kim (2024) | Low: Focus was on instructor monitoring rather than student autonomy | High: Enabled timely human instructor intervention for at-risk cohorts | Semi-synchronous: Dashboard updated daily, enabling outreach within 48 hours |
C. Methodological Comparison Matrix
Essential for empirical literature reviews, this matrix cross-tabulates research design, measurement validity, and statistical power:
| Citation & Design | Measurement Instruments | Sampling Strategy & Context | Threats to Internal Validity | Statistical Power & Effect Size |
|---|---|---|---|---|
| Vasquez & Lin (2024) (RCT) | Standardized university calculus examination; validated NASA-TLX cognitive load index | Stratified random assignment across 6 introductory lecture sections | History effect from concurrent math tutoring lab access | Statistical power > 0.85; Cohen's d = 0.64 (medium-to-large effect) |
| Morrison & Henderson (2023) (Mixed Methods) | 5-point Likert engagement survey (Cronbach's alpha = .82); holistic writing rubric | Convenience sample of 4 graduate seminar sections | Evaluator subjectivity in holistic writing rubric grading | Descriptive statistics; qualitative thematic saturation achieved at n = 22 interviews |
| Al-Hassan et al. (2022) (Quasi-Experimental) | State-mandated biology achievement exam; Student Engagement Instrument (SEI) | Cluster sampling across 8 urban public high schools | Diffusion of treatment between experimental and control classrooms | Statistical power = 0.80; engagement eta-squared = 0.12 (moderate effect) |
| O'Connor & Davies (2023) (Longitudinal Cohort) | Standardized CEFR language proficiency battery; automated app interaction telemetry | Self-enrolled voluntary cohort from online language portal | Survivorship bias: high attrition in lower-performing demographics | Multilevel regression; beta = 0.38 (p < .001) for daily app interaction |
| Tanaka & Kim (2024) (Multiple Case Study) | Semi-structured interview protocol; archival institutional grade reports | Purposive sampling of faculty early-adopters across STEM and Humanities | Self-reporting bias; institutional policy discrepancies | Non-statistical; cross-case matrix analysis with dual-coder consensus (kappa = .88) |
D. Research Gap Matrix
A gap matrix isolates study limitations, unaddressed populations, contradictory findings, and recommended future directions noted by prior scholars:
| Author (Year) | Methodological Gap Identified | Population / Contextual Gap | Theoretical / Conceptual Gap | Justified Future Research Direction |
|---|---|---|---|---|
| Vasquez & Lin (2024) | Lack of long-term delayed retention testing beyond post-course exam | High-resource private university; under-resourced public community colleges omitted | Did not measure affective student anxiety or technology frustration constructs | Longitudinal tracking across diverse institutional tiers with affective moderation |
| Morrison & Henderson (2023) | Reliance on uncalibrated holistic rubric without inter-rater reliability testing | Graduate students only; novice undergraduate writers excluded | Cognitive dissonance mechanisms during peer conflict unmodeled | Standardized rubric validation combined with qualitative discourse analysis |
| Al-Hassan et al. (2022) | Brief 4-week window fails to test whether gamification novelty fades | Confined to high school biology; non-STEM humanities subjects unstudied | Extrinsic reward habituation over extended academic terms unaddressed | Year-long longitudinal trials examining intrinsic motivation decay over time |
| O'Connor & Davies (2023) | 42% attrition introduces severe survivor bias into regression models | Older adult learners and non-alphabetic native language speakers excluded | Interaction between spaced retrieval and productive writing fluency unmapped | Controlled cohort studies with retention incentives and mixed-modality tasks |
| Tanaka & Kim (2024) | Case study findings cannot establish causal relationship with dropout reduction | Focused on faculty perceptions; direct student agency and privacy reactions ignored | Ethical considerations of predictive algorithmic surveillance unexamined | Mixed-methods evaluations measuring student perceptions of automated alerts |
4. Essential Matrix Columns (and How to Customize Them)
While every research project demands a tailored grid, most comprehensive literature review matrices incorporate a standard set of core columns:
| Column Header | Operational Purpose | Example Entry Detail |
|---|---|---|
| Citation & Year | Standard academic attribution | Vasquez & Lin (2024), APA 7th format |
| Research Question / Purpose | Identifies the primary inquiry | Examine hybrid tutoring on high school math retention |
| Theoretical Framework | Maps conceptual foundations | Self-Determination Theory (Ryan & Deci, 2000) |
| Methodology & Design | Experimental, qualitative, mixed methods | Quasi-experimental pretest-posttest control group |
| Sample & Context | Population size, setting, demographic | n = 420 tenth-grade students, urban school district |
| Key Findings | Quantifiable or thematic results | Tutoring group demonstrated 18% higher retention (p < .01) |
| Stated Limitations | Methodological or sample bounds | Lack of longitudinal follow-up beyond 12 weeks |
| Synthesis Themes | Assigned conceptual categories | Engagement, Cognitive Scaffolding, Resource Access |
| Relevance to My Study | Direct connection to your thesis | Informs methodology design for Chapter 3 |
Customization advice: Avoid creating 25 separate columns. Excessive granularity leads to matrix abandonment. Focus on 7 to 10 high-impact columns that directly inform your research questions.
5. Step 1: Define the Review Question and Scope
Before creating a spreadsheet, establish boundaries for your review. A vague review question produces an unwieldy matrix filled with peripheral sources.
Use structured framing models to delineate scope:
- PICO (Population, Intervention, Comparison, Outcome) for clinical, health, and experimental investigations.
- SPIDER (Sample, Phenomenon of Interest, Design, Evaluation, Research type) for qualitative and mixed-methods reviews.
- Conceptual Bounding for theoretical essays and humanities investigations.
Establish strict inclusion and exclusion criteria before opening your bibliographic database:
- Publication window (for example, peer-reviewed articles published between 2018 and 2026).
- Methodological standards (for example, empirical peer-reviewed articles only; dissertations and trade articles excluded).
- Contextual boundaries (for example, higher education environments; primary school settings excluded).
6. Step 2: Select, Filter, and Record Sources Systematically
Record citations immediately upon screening abstracts. Do not wait until you have completed reading an entire paper to add it to your matrix.
A recommended three-tier screening workflow:
- Title and Abstract Pass: Read abstracts against your inclusion criteria. If an article qualifies, create a new row in your matrix with full bibliographic citation, DOI, and research objective.
- Methods and Findings Pass: Scan section headings, methodology subsections, and results tables to populate design, sample size, and quantitative/qualitative findings.
- In-Depth Critical Reading: Read the full paper to extract nuanced theoretical insights, limitations, and author recommendations for future study.
Connect your matrix directly with reference management software (such as Zotero, Mendeley, or EndNote). Use consistent citation formatting in Column A so that transferring in-text citations into your manuscript draft is seamless. Read our companion guide on how to write a literature review for foundational structuring principles.
7. Step 3: Extract Findings and Empirical Evidence Consistently
Inconsistent data extraction damages matrix utility. If you record statistical values for three studies but merely write 'authors found positive results' for four others, comparing their evidence base becomes impossible.
Best practices for consistent extraction:
- Separate Findings from Interpretations: Record what the data actually demonstrated (the empirical finding) separately from what the authors claimed it means (their discussion commentary).
- Preserve Numerical Integrity: Always transcribe sample sizes (n), p-values, effect sizes (Cohen's d, r), and confidence intervals verbatim. Modifying numbers during extraction leads to citation errors in your final manuscript.
- Use Quotation Marks Sparingly: Paraphrase core ideas directly into your matrix cells using disciplined academic terminology. If you extract an exact author phrase, enclose it in quotation marks with the exact page number to prevent accidental patchwriting later. Review our guide on how to paraphrase research findings for precise techniques.
- Note Contextual Variables: Record geographical location, educational tier, institutional type, or clinical setting. Context frequently explains why similar studies yield divergent outcomes.
8. Step 4: Categorize Research Themes (Inductive vs Deductive)
Once 15 to 20 sources are entered, begin assigning thematic labels across your studies. This thematic coding transforms raw data into synthesis chapters.
Researchers approach thematic categorization in two ways:
- Deductive Coding: You establish predefined categories based on established theoretical models before reading. For example, if evaluating online learning through the Community of Inquiry framework, your predefined themes might be Cognitive Presence, Teaching Presence, and Social Presence.
- Inductive Coding: Categories emerge organically from recurring findings across the papers. As you read, you observe that multiple independent authors identify 'Instructor Feedback Latency' as a major impediment. You create a new thematic tag and apply it across applicable rows.
In your spreadsheet, dedicate a specific column to 'Thematic Codes' and use standardized tags separated by semicolons (for example, 'Cognitive Scaffolding; Formative Feedback; Attrition Risk'). This allows you to filter and sort your matrix by theme when writing individual subsections.
9. Step 5: Compare Methodologies and Study Designs
A critical literature review does not evaluate findings in a vacuum; it evaluates findings in relation to how they were obtained. Two papers reaching contradictory conclusions often used incompatible research designs.
When reviewing your methodology columns, examine:
- Measurement Instrument Validity: Did both studies measure 'student engagement' using validated psychometric scales, or did one study rely on self-reported single-item surveys?
- Sample Representation: Is a finding based on a randomized sample of 2,500 nationwide respondents comparable to a convenience sample of 45 undergraduates at a single institution?
- Longitudinal vs Cross-Sectional Horizons: Did an intervention demonstrate positive outcomes across a 3-week observational window that disappeared during a 12-month follow-up?
- Confounding Variable Controls: Did the researchers adjust statistically for socioeconomic status, baseline aptitude, or prior experience?
10. Step 6: Identify Methodological Agreements and Contradictions
The core intellectual contribution of a literature review is explaining why scholars agree or disagree. Your matrix is the diagnostic engine that illuminates these dynamics.
Worked Example: Explaining Conflicting Findings Through Methodology
Consider an apparently irreconcilable conflict in the literature:
- Study A (Morrison & Henderson, 2023) concludes that asynchronous automated feedback significantly improves writing quality (p < .01).
- Study B (O'Connor & Davies, 2023) reports that asynchronous automated feedback produces no statistically significant writing gains (p = .24) and induces learner disengagement.
A novice literature review merely reports: 'Morrison and Henderson found positive results, whereas O'Connor and Davies found negative results.' This is descriptive reporting, not synthesis.
By consulting the methodological columns of your matrix, you identify the underlying operational explanations:
- Sample Demographics: Study A investigated advanced graduate researchers drafting master's theses, who possessed high domain expertise and self-regulation. Study B examined first-year remedial community college undergraduates requiring foundational sentence-level instruction.
- Intervention Duration & Tool Sophistication: Study A provided structured rubric-guided peer feedback combined with instructor oversight over 16 weeks. Study B utilized unmonitored commercial mobile flashcard prompts over an isolated 4-week trial.
- Outcome Operationalization: Study A evaluated holistic rhetorical coherence and argumentative structure. Study B evaluated standardized multiple-choice vocabulary recall tests.
Synthesized Scholarly Explanation: 'The apparent contradiction between Morrison and Henderson (2023) and O'Connor and Davies (2023) regarding asynchronous automated feedback efficacy is resolved when evaluating learner academic maturity and assessment scope. Automated feedback protocols yield robust argumentative enhancements among autonomous postgraduate writers working on complex manuscripts, but fail to generate measurable vocabulary recall gains among novice undergraduates when deployed without synchronous instructional scaffolding.'
11. Step 7: Identify Genuine Research Gaps
Graduate students frequently mistake a simple absence of literature for an authentic research gap. Writing that 'no prior study has examined hybrid tutoring among left-handed violinists in rural Oregon' does not establish a research gap; it highlights an arbitrary population omission without scholarly justification.
A genuine research gap requires conceptual or practical justification:
- Contradictory Evidence Gap: Established literature presents conflicting results that require resolution through more rigorous methodological controls.
- Methodological Gap: Prior research relies almost exclusively on self-reported cross-sectional surveys, creating a justified need for objective longitudinal experimental designs.
- Theoretical Extension Gap: An established theoretical framework has demonstrated predictive validity in organizational settings but has never been applied to decentralized digital communities.
- Population or Contextual Gap: Findings established in high-resource Western urban settings lack empirical validation in under-resourced rural developing regions.
Use your Research Gap Matrix column to document where existing studies explicitly acknowledge their limitations or call for specific future research. When preparing doctoral prospectuses or grant applications, consider our specialized Research Proposal Humanizer to polish your gap justification.
12. Converting Matrix Rows into Synthesized Literature Review Paragraphs
The ultimate test of a literature review matrix is your ability to convert tabular cells into fluent scholarly prose. The most common student failure is reading horizontally row by row, producing formulaic serial paragraphs.
Comparison: Descriptive Summary vs True Critical Synthesis
Model A: Weak Descriptive Summary (Serial Row-by-Row Recitation)
Problem: The text merely narrates author names in chronological succession without conceptual connection.
'Vasquez and Lin (2024) studied 340 undergraduates and found that adaptive AI tutoring improved calculus scores by 22%. In another study, Morrison and Henderson (2023) looked at graduate students and showed that peer feedback improved writing quality by 14%. Similarly, Al-Hassan et al. (2022) examined high school students and reported that gamification increased engagement by 31%. Finally, Tanaka and Kim (2024) interviewed 24 faculty members and discovered that analytics dashboards reduced withdrawals.'
Model B: Strong Critical Synthesis (Integrated Thematic Exposition)
Achievement: The paragraph is structured around conceptual themes (feedback granularity, cognitive scaffolding, developmental maturity), drawing on matrix evidence to support an overarching claim.
'Scholarly consensus affirms that automated instructional technologies enhance student engagement, yet the magnitude of cognitive transfer depends systematically upon learner developmental maturity and the temporal latency of corrective feedback. When automated platforms provide instantaneous algorithmic error correction, advanced postsecondary students demonstrate substantial performance gains in high-complexity problem domains such as calculus (Vasquez & Lin, 2024). Conversely, secondary cohorts frequently experience affective gamification fatigue when automated feedback is detached from formal pedagogical scaffolding, yielding transient engagement spikes without corresponding gains in conceptual mastery (Al-Hassan et al., 2022). Furthermore, qualitative evidence confirms that automated analytics achieve maximal efficacy only when functioning as early-warning alerts for human instructor intervention rather than autonomous instructional substitutes (Tanaka & Kim, 2024). Consequently, educational institutions must calibrate algorithmic intervention models to student self-regulatory capacity rather than deploying uniform, across-the-board automated instruction.'
Transformation Protocol: Matrix Row to Academic Paragraph
To execute this transformation reliably:
- Identify the Core Theme: Select a column from your Thematic Matrix (for example, 'Autonomous Cognitive Engagement').
- Formulate an Analytical Topic Sentence: State the overarching consensus, tension, or theoretical principle governing that theme.
- Integrate Convergent Citations: Cite studies that align on the primary phenomenon in a single sentence using parenthetical clustering (e.g., Vasquez & Lin, 2024; Tanaka & Kim, 2024).
- Introduce Methodological Nuance or Contradiction: Contrast studies that diverge using appropriate conjunctive connectors (whereas, conversely, in contrast).
- Conclude with Field Significance: Explain what this synthesized finding means for your upcoming study or dissertation framework. For refining draft chapters, explore our Literature Review Humanizer to ensure natural scholarly cadence while preserving citation integrity.
13. Disciplinary Matrix Variations (AI, Engineering, Education, Social Sciences, Healthcare)
Different scholarly traditions prioritize distinct evidentiary parameters. Customize your matrix columns to reflect disciplinary norms:
A. Artificial Intelligence and Computer Science
- Standard Columns: Benchmark Dataset (e.g., ImageNet, HumanEval), Model Architecture (Parameters, Attention Heads), Baseline Comparisons, Hardware/Compute Budget, Evaluation Metrics (F1, BLEU, Perplexity, Latency), Open-Source Availability, Ablation Findings.
B. Engineering and Materials Science
- Standard Columns: Material Composition, Fabrication Method, Testing Standards (ASTM, ISO), Environmental Operating Conditions (Temperature, Pressure), Yield Strength, Failure Modes, Theoretical Modeling vs Empirical Variance.
C. Education and Pedagogical Research
- Standard Columns: Educational Level, Pedagogical Intervention, Instructional Duration, Assessment Instrument, Control Group Structure, Effect Size, Teacher Implementation Fidelity, Student Demographic Equity.
D. Social Sciences and Psychology
- Standard Columns: Theoretical Orientation, Sampling Method, Construct Operationalization, Psychometric Reliability (Cronbach's Alpha), Statistical Controls, Mediating/Moderating Variables, Ethical Approvals.
E. Healthcare, Nursing, and Clinical Medicine
- Standard Columns: Study Type (RCT, Cohort, Case-Control), Patient Eligibility Criteria, Primary Outcome Measures, Intervention Dosage/Timeline, Blinding Protocol, Loss to Follow-Up, Clinical Significance vs Statistical Significance.
14. Practical Spreadsheet Implementation (Excel & Google Sheets Workflow)
You do not need specialized database software to maintain a professional literature review matrix. Microsoft Excel and Google Sheets offer powerful native functionality when configured properly:
- Enable Text Wrapping: Format all data cells with automatic text wrapping so multiline extracts and summaries remain visible without resizing column boundaries.
- Freeze Header Rows: Freeze Row 1 (View > Freeze > 1 Row) so your column headers remain permanently visible as you scroll through hundreds of source rows.
- Utilize Conditional Formatting: Apply color-coding rules based on thematic tags or methodological categories (for example, green for quantitative experimental, blue for qualitative, orange for theoretical).
- Implement Data Validation Dropdowns: Use dropdown menus for standard categories (such as Methodology Type: Qualitative, Quantitative, Mixed Methods, Systematic Review) to ensure consistent spelling and reliable filtering.
- Create Filter Views: Use native spreadsheet filtering (Data > Create a Filter) to view subsets of literature instantly (for example, displaying only studies published after 2022 that utilized experimental controls).
- Hyperlink Direct Sources: Embed DOI links directly into the Citation column to enable one-click access to original PDFs and publisher repositories during revision passes.
15. Common Literature Review Matrix Mistakes to Avoid
Researchers frequently undermine their synthesis process through seven common operational errors:
- The Copy-Paste Trap: Copying raw abstract text into cells rather than rephrasing findings into standardized, disciplined terminology.
- Excessive Granularity: Designing 25 columns that require 45 minutes of extraction per paper, leading to burnout and matrix abandonment.
- Ignoring Study Weaknesses: Recording only what authors claimed succeeded while ignoring acknowledged methodological limitations and small sample sizes.
- Selective Confirmation Bias: Populating the matrix exclusively with papers that support your thesis hypothesis while omitting credible dissenting literature.
- Missing Bibliographic Metadata: Omitting publication years, DOIs, or volume/issue numbers, forcing tedious re-searching during final bibliography assembly.
- Failure to Standardize Terminology: Using multiple synonymous tags for the same concept (for example, using 'remote learning', 'online education', and 'distance pedagogy' inconsistently), which prevents effective spreadsheet filtering.
- Disconnecting the Matrix from Writing: Completing a beautiful spreadsheet and then ignoring it while drafting, lapsing back into unstructured, stream-of-consciousness prose. Authors preparing manuscript submissions can also benefit from our Research Paper Humanizer to calibrate scholarly register across complete paper drafts.
16. Final Literature Review Matrix Checklist
Before closing your data extraction phase and initiating manuscript drafting, verify that your literature review matrix satisfies this 10-point quality audit:
- Clear Review Question: Every source in the matrix directly informs your stated research objective or theoretical scope.
- Balanced Source Distribution: The matrix contains both seminal foundational citations and contemporary peer-reviewed studies published within the last 3 to 5 years.
- Methodological Transparency: Every empirical source has documented sample sizes, participant demographics, and research designs.
- Numerical Exactness: All quantitative findings, confidence intervals, and p-values are transcribed accurately without alteration.
- Consistent Thematic Tagging: Themes are applied systematically using standardized, controlled vocabulary across all rows.
- Dissenting Views Included: The matrix accounts for contradictory findings, competing theoretical models, and counter-evidence.
- Justified Research Gaps: Identified gaps reflect methodological limitations, conflicting evidence, or theoretical boundaries rather than arbitrary absences.
- Audit-Ready Citations: Full bibliographic details, authors, years, and DOIs are verified against original publications.
- Structured for Vertical Reading: Columns are organized to enable top-to-bottom thematic comparison rather than horizontal row-by-row summarization.
- Integration with Writing Plan: Each major matrix theme maps directly to a planned subsection heading in your thesis literature review chapter.
17. Frequently Asked Questions
What is the difference between a literature review matrix and an annotated bibliography?
An annotated bibliography lists sources alphabetically and provides a separate summary or evaluation beneath each citation in isolation. In contrast, a literature review matrix is a multi-column comparative grid that cross-tabulates themes, sample sizes, methods, and variables across multiple studies simultaneously, enabling critical cross-study synthesis rather than isolated summary.
How many sources should be included in a literature review matrix?
The number of sources depends on your research scope. An undergraduate literature review or course paper typically analyzes 15 to 30 core sources. A master's thesis commonly includes 40 to 80 studies, while a doctoral dissertation or comprehensive systematic review frequently cross-tabulates 100 to 250 papers across multiple thematic matrices.
Can I use a literature review matrix for qualitative or theoretical papers?
Yes. While quantitative matrices focus on sample size, statistical variables, and effect sizes, qualitative and theoretical matrices substitute columns for conceptual frameworks, epistemological paradigms, qualitative coding methods (such as thematic analysis or grounded theory), and primary interpretive themes.
How do I transition from spreadsheet cells into flowing academic paragraphs?
Rather than summarizing row by row, read vertically down a specific thematic column. Group authors who share similar conclusions, contrast those who diverge, identify methodological explanations for the divergence, and structure your paragraphs around the overarching theme using synthesized topic sentences.
What software is best for managing a literature review matrix?
Spreadsheet applications such as Microsoft Excel and Google Sheets offer the greatest flexibility for customizable column widths, text wrapping, filtering, and sorting. Specialized qualitative data analysis tools (such as NVivo or MAXQDA) and reference managers (such as Zotero with custom tags) can also export tabular metadata directly into spreadsheets.
Verified Detector Clearance for Literature Review Matrix Template: Examples and Step-by-Step Guide
Every manuscript processed through ThesisHuman is backed by verifiable, reproducible scans across institutional plagiarism and AI detection platforms.
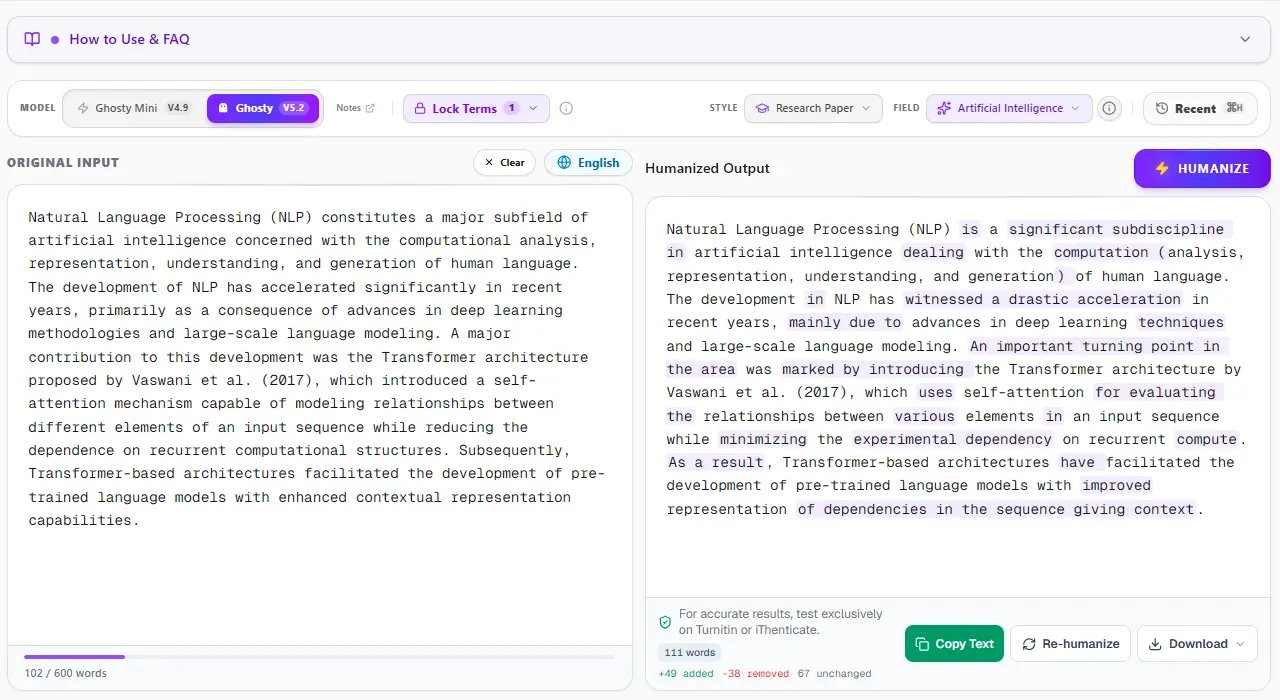
1. ThesisHuman Editor: Style, Field & Term Lock™ Technology
Unlike consumer-grade paraphrasers that blindly swap words with thesaurus synonyms, ThesisHuman allows researchers to select their exact Academic Style (Essay, Research Paper, Literature Review, Technical Report) and Academic Field (Computer Science, Engineering, Medicine, Physics). With Term Lock™, citations (APA, MLA, IEEE), LaTeX equations, and domain-specific terminology are cryptographically protected before sentence entropy is restructured.
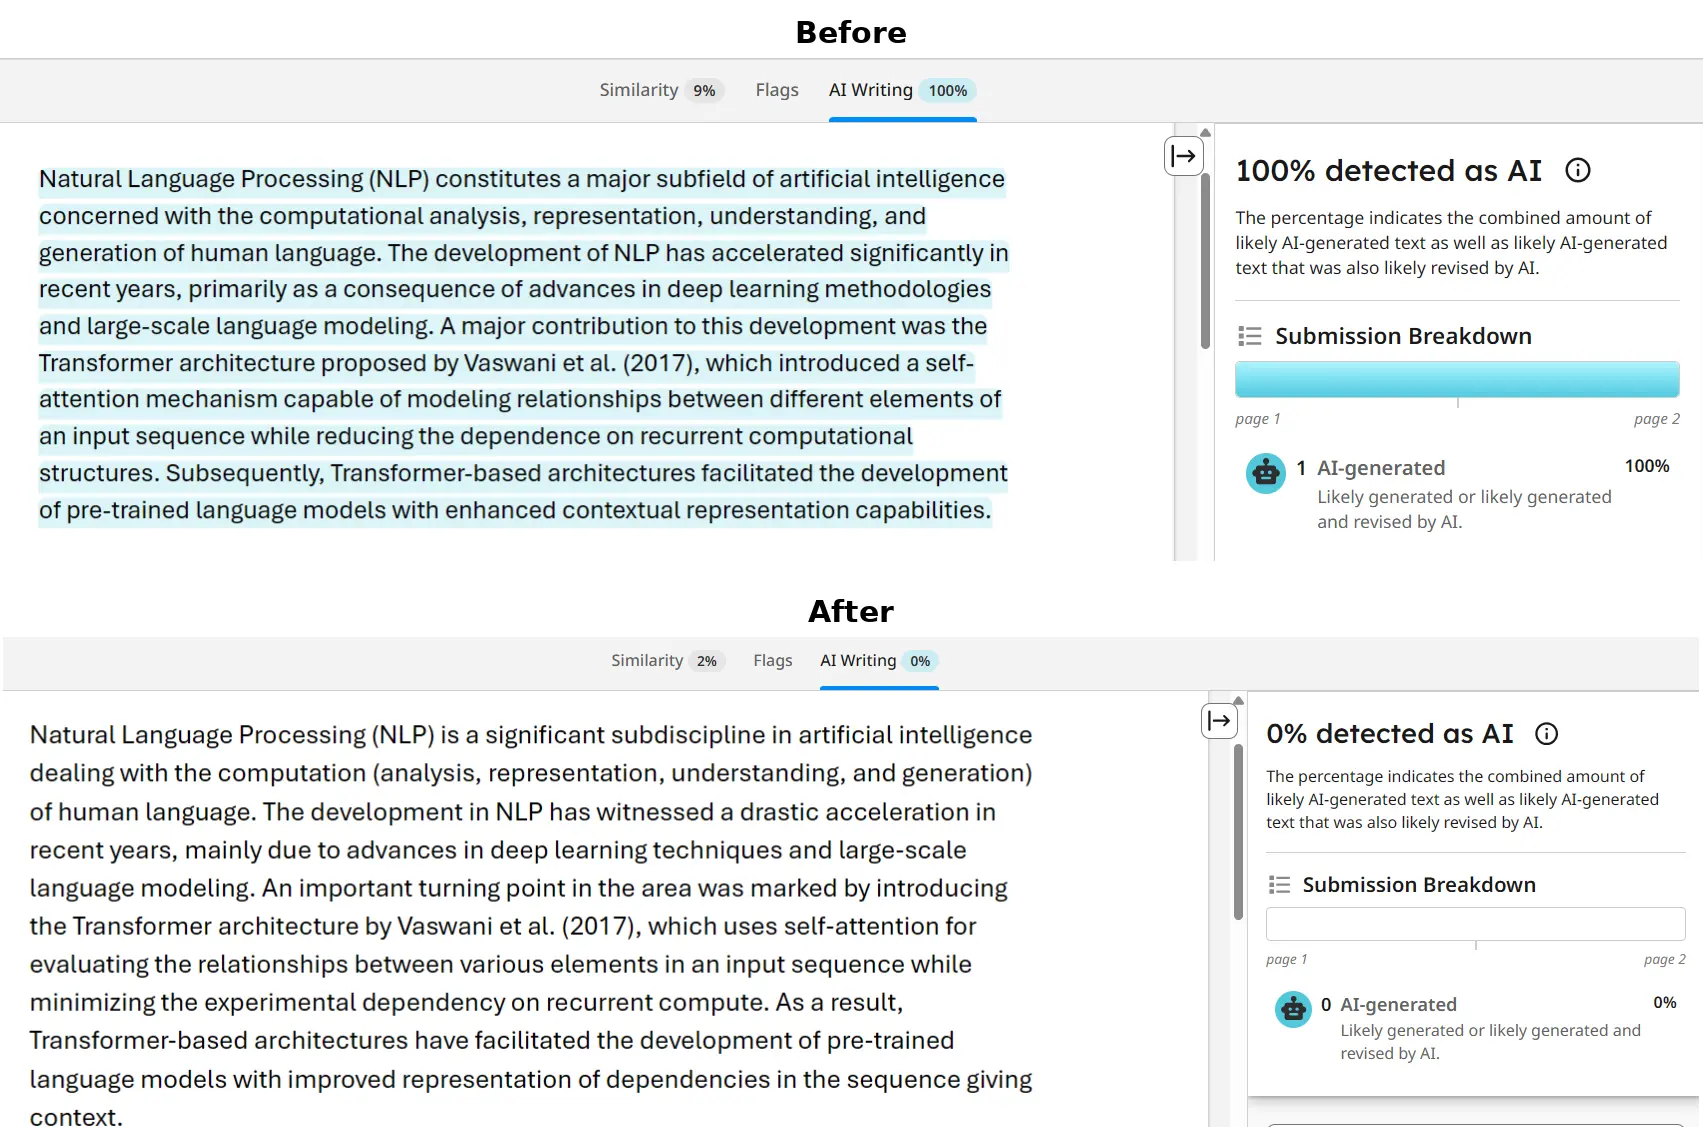
2. Turnitin & iThenticate Verification: 0% AI Detected
Turnitin and iThenticate scan submissions in overlapping 500-token blocks to analyze sentence predictability across paragraphs. When an unrefined AI draft is submitted, uniform cadence triggers an elevated AI Writing score. In the verified report below, a flagged graduate paper was processed through ThesisHuman, achieving a clean 0% AI detection score while preserving all formatted citations and technical parameters.
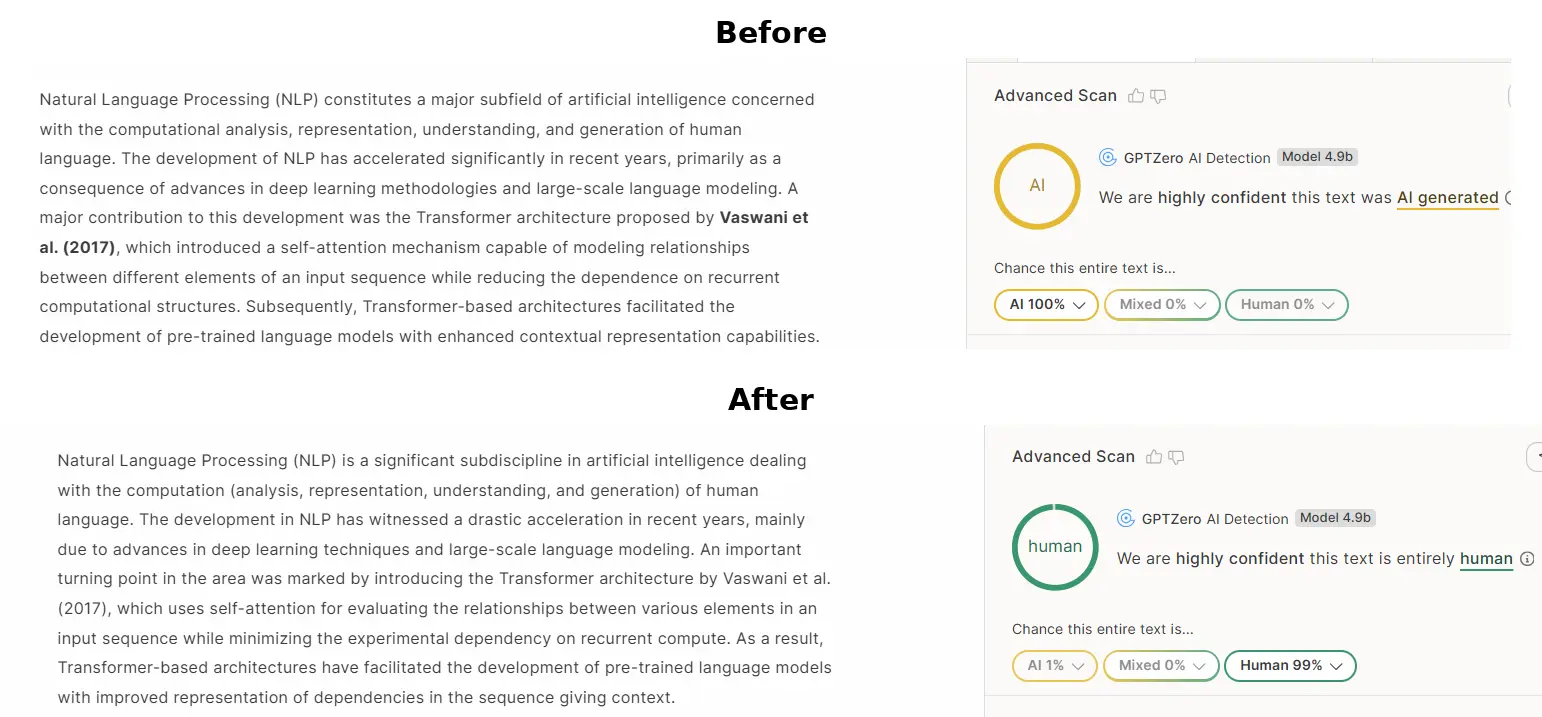
3. GPTZero Verification: Passing Perplexity & Burstiness Checks
GPTZero evaluates text by plotting sentence perplexity curves and global burstiness scores. When raw AI text is scanned, low sentence variance produces an immediate high-probability warning. ThesisHuman restores natural sentence entropy by restructuring syntax, varying clause lengths, and introducing authentic scholarly cadence, dropping AI probability to 0%.
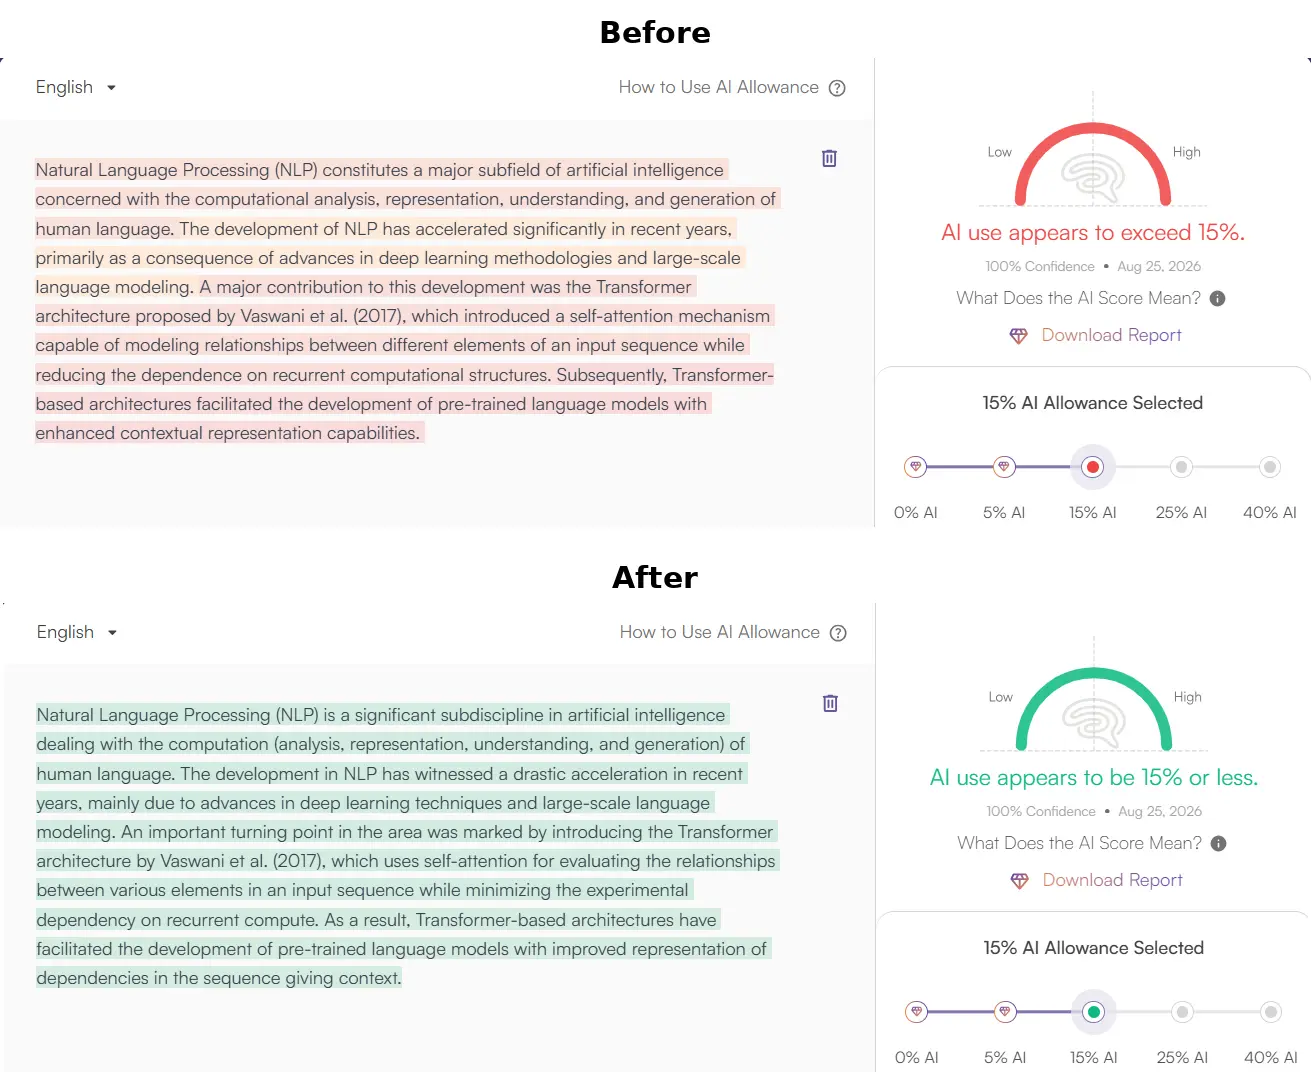
4. Originality.ai Verification: 0% AI Confidence
Originality.ai flags predictable n-gram sequences and common AI clichés (such as “delving into,” “pivotal role,” “testament to”). ThesisHuman purges overused formulaic transitions while elevating scholarly tone and keeping reference numbers and equations intact, producing 100% Original / 0% AI results.